Whether you're a marketer, product analyst, researcher, or insights lead.
Statistic Insights
Insight backed by statistics, delivered in minutes with readable summaries of your data.
AI-guided Insight
Get AI-guided insights and storytelling from your data, not just raw numbers.
Collaboration with Teams
Arif allows you to make a project and collaboration with teams to make work efficience.
Committed Data Privacy
Your insights remain fully protected, ensuring your data stays secure at all times.
Unlock powerful features for faster results.
Allows you to gain insights from any data or table data without manual processing.
Converts speech from audio or video files into text automatically, saving you time and effort.
Categorize users into personas based on data insights. Allows businesses to identify their target market effectively.
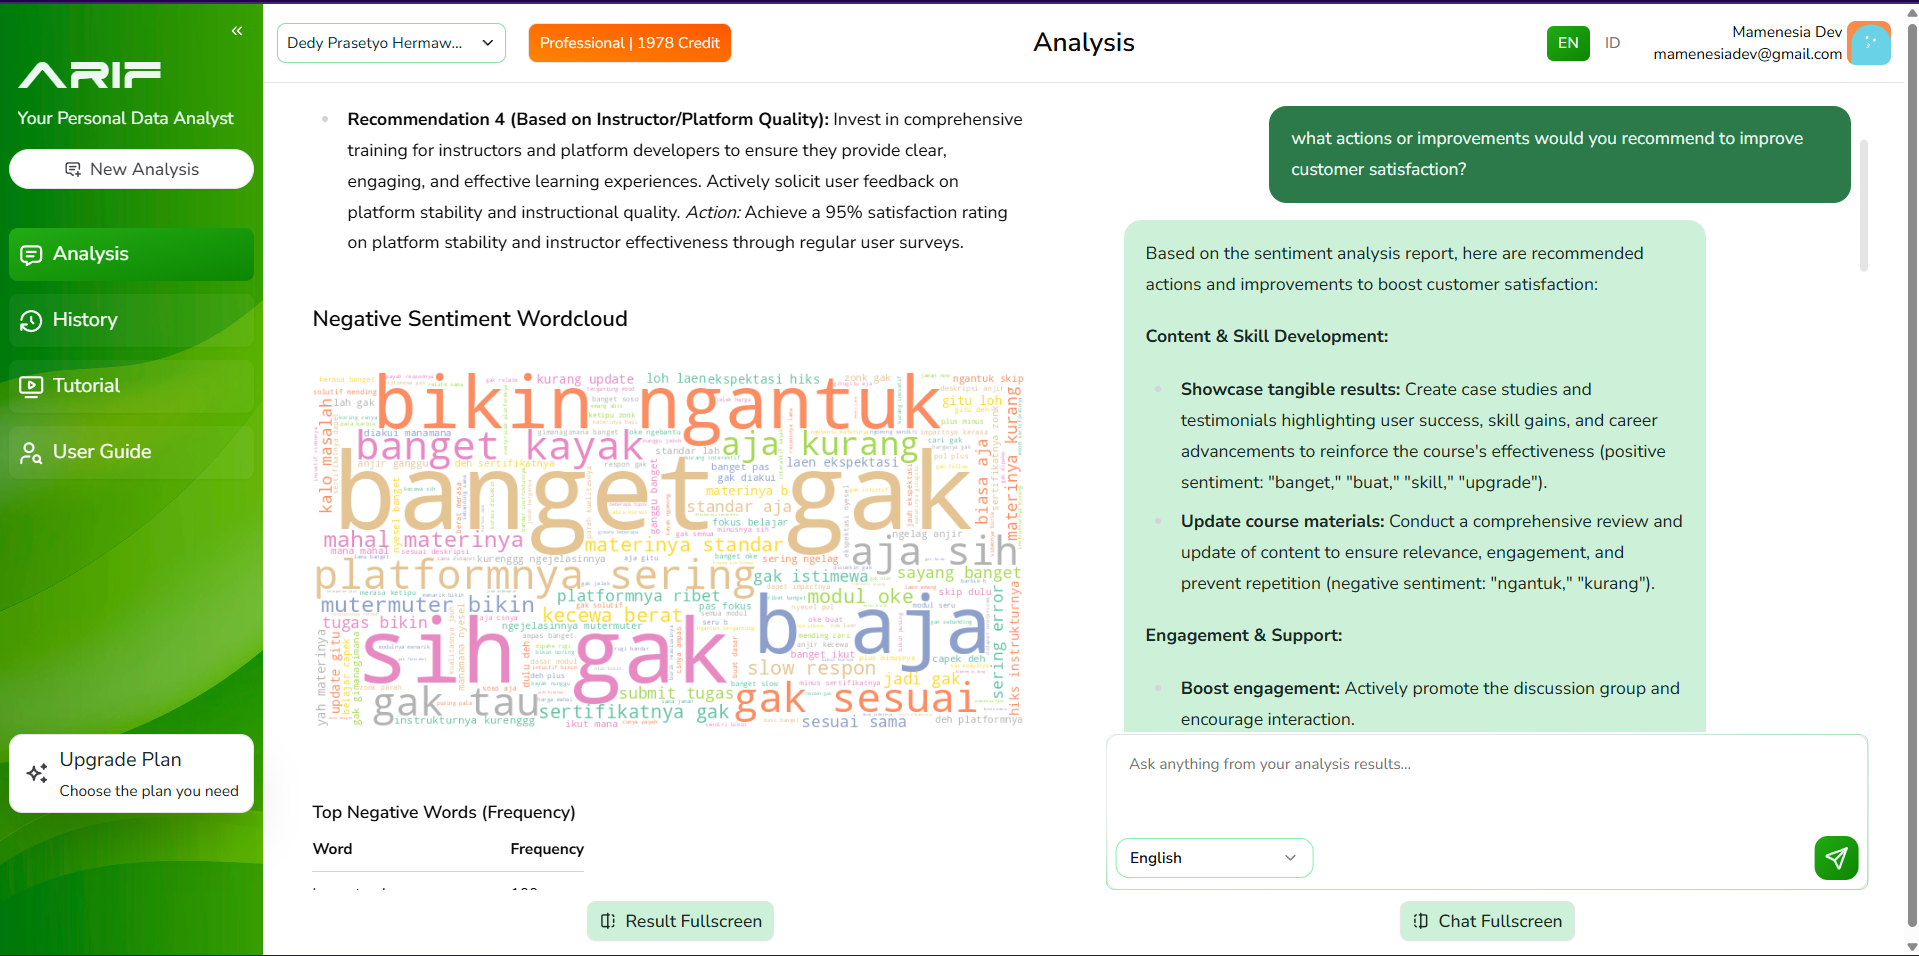
Identifies the most frequently mentioned words and classifies them into positive and negative sentiments.
Provides an organized view of your data visualization in a chart, making it easier to interpret key insights.
Regression analysis is to identify the linear relationship between the target variable and the other variables.
Correlation Analysis to analyze the strength of relationship between the variables.
Factor Analysis to simplify the set data by finding underlying patterns and grouping similar variables.
Gap Analysis to identify the gap between the current state and the desired state.
Cross-tabulation is analysis to identify the relationship between two or more categorical variables.
Trend Analysis is analysis to identify the relationship between two or more categorical variables.
ARIF is AI data analytics with integrity.

Complete control over your data and its usage

Clear and honest policies on data collection

Robust encryption, access controls, and regular security audits





Crafted to Be Faster, Safer, and More Intuitive
A structured comparison across key capabilities.
Choose the right tool for your analytical needs.
| Goal | Primary Fit | Why |
|---|---|---|
| Deep consumer insights (drivers, segmentation, sentiment) | ARIF | Statistical rigor + AI narratives that support strategic decisions |
| Quick marketing KPI exploration & reporting | Julius | Fast query & campaign summaries - effective for marketing ops |
| Interactive dashboards & visual storytelling | Powerdril | Strong visuals + BI workflows |
| Easy BI with automated insights for small teams | Ajelix | Conversational analysis + simple dashboards |
Deep consumer insights (drivers, segmentation, sentiment)
ARIF
Statistical rigor + AI narratives that support strategic decisions
Quick marketing KPI exploration & reporting
Julius
Fast query & campaign summaries - effective for marketing ops
Interactive dashboards & visual storytelling
Powerdril
Strong visuals + BI workflows
Easy BI with automated insights for small teams
Ajelix
Conversational analysis + simple dashboards
For consumer insights + marketing analysis, the analytical needs go well beyond seeing numbers: you need to understand drivers of behaviour, consumer segments, sentiment patterns, and causal relationships. Based on that strategic lens:
ARIF stands out as the best choice for deep, decision-ready consumer and marketing analytics, combining statistical methods with interpretive, narrative insights.
Julius, Powerdril, and Ajelix can support specific parts of the workflow (quick queries, dashboarding, light BI), but ARIF gives the strongest analytical depth for consumer behavior and marketing analysis.
Arif is a groundbreaking AI solution to support market research and insight generation. I believe this is just a beginning of the transformative revolution.

Rio F. Kiantara
Founder & Managing Director, Market Research
I uploaded my resume to Arif to fine-tune it for a Business Analyst role, especially given my experience in the pharmaceutical industry. Arif helped me bridge the gap between my industry-specific background and the analytical skills required for the role. Unlike other AI tools, it offered highly relevant, targeted feedback that directly aligned with my job goals. The result was a resume that felt much more refined and tailored, giving me a clear edge.

Sapthami Kumar
Business Analyst, Pharmaceutical Industry
Still have a question? Contact Us
ARIF combines AI and statistical models to deliver fast, reliable, insights you can act on.
ARIF handles both structured and unstructured data, whether you’re analysing a survey, a pitch deck, or a recording audio, ARIF can extract the insights you need.
ARIF is built for business decision makers, no tech skills needed. Just upload your data and get insights, no coding required.
Your data is never used for AI training. We use encryption, secure cloud infrastructure, and follow PDPA, APP & GDPR.
Most insights are generated within seconds to a few minutes, depending on file size and complexity.
ARIF doesn’t just visualize, it analyzes. It helps you understand “why” things happen and suggests “what to do next,” like your personal AI data analyst.
Yes. ARIF offers flexible plans through PREMIUM. You can cancel your PROFESSIONAL plan anytime.
Absolutely. We offer a FREE trial so you can explore ARIF’s capabilities before committing.
We provide customized pilots for enterprise teams with onboarding support, dedicated analysts, and API integration
ARIF is suitable for researchers, universities, and think tanks—especially for survey analysis, mixed methods, and summarizing data.
No. ARIF's Agentic Mode automatically selects the right statistical method for your question — segmentation, driver analysis, regression, sentiment scoring, and more — so you never have to know which analysis to run. Just upload your data and ask your question in plain language.
Agentic Mode is ARIF's AI system that reads your dataset and your question, then automatically decides and runs the right combination of statistical analyses — for example, driver analysis and sentiment scoring for a question like 'why did satisfaction drop?' — and explains the findings without you having to choose a method yourself.
When you ask a question about your data, ARIF's Agentic Mode evaluates your dataset and your question, then automatically selects and runs the appropriate statistical methods to answer it — you don't need to know which technique applies.
For survey and consumer research analysis, yes. ARIF's Agentic Mode automatically applies deeper statistical methods — segmentation, driver analysis, sentiment scoring — based on your question and explains the "why" behind the numbers, without requiring any statistics knowledge. Julius.ai is built for quick marketing KPI exploration; ARIF is built for decision-ready consumer and research insights.
Yes. ARIF's interface and AI-generated outputs are available in both English and native Bahasa Indonesia, making it one of the few AI analytics platforms built for the Indonesian market as well as global use.
Upload your survey dataset to ARIF and describe what you want to know — Agentic Mode automatically runs the right analysis (cross-tabulation, segmentation, correlation, sentiment) and explains the findings in plain language. No formulas, scripts, or statistics background required.
ARIF is built to be the easiest AI data analysis tool for marketers who aren't data scientists. Upload raw data and ask a question in plain language — Agentic Mode figures out which analysis to run and delivers statistically-backed insights and recommendations, with no coding, dashboards, or stats background required.
Yes. ARIF applies statistical segmentation models to your customer or survey data to identify distinct groups, then explains what separates each segment and why it matters for your strategy.
Yes. ARIF analyzes open-ended survey responses, reviews, or transcripts for sentiment automatically — no coding or manual tagging required — and summarizes the patterns in a narrative report.
ARIF is an AI-powered, no-code analytics platform that helps you explore and understand your data, then turns it into clear insights, charts, and actionable recommendations without manual data processing.
ARIF is designed for business professionals and analysts (e.g., marketing, research, HR, product, operations) who need insights quickly and prefer a self-service workflow.
You can analyze structured data (CSV/XLSX) and documents (XLSX, CSV, PDF text, DOCX, PPTX, depending on the feature) to uncover patterns, relationships, segments, and trends, and to generate summaries and recommendations.
Use these resources for step-by-step guides and examples: • Tutorials: goarif.co/tutorial • Articles: goarif.co/articles • Documentation: docs.goarif.co
ARIF produces AI-assisted insights and analytics outputs across multiple features (e.g., document analysis, transcription, sentiment analysis, customer segmentation, and statistical analyses). Outputs may include summaries, business interpretation, charts and tables, and recommendations depending on the selected feature and prompt.
For most analysis features (all features except Transcribe), you can download two report formats: • Insight Summary (PPT): a presentation-style summary for quick understanding and sharing. • Insights & Statistics (PDF): a more detailed report with deeper explanation and supporting statistics. For Transcribe, outputs are provided as: • Transcript (Word/DOCX): includes speaker labels (no timestamps). • Transcript (Excel/XLSX): includes timestamps and speaker labels. Per features might have additional downloadable results. Please refer to the feature FAQ.
In general: • Insight Summary (PPT) focuses on executive-level presentation: summary, business interpretation, and recommendations. • Insights & Statistics (PDF) focuses on supporting evidence: deeper analysis and statistical details. The exact content varies by feature. Feature-specific details are provided in separate feature guides.
ARIF outputs are designed to support analysis and decision-making. Interpretation depends on the feature used and the quality of your dataset. As a general rule: • Results depend on the completeness, accuracy, and relevance of the data you upload. • Your prompt influences what the analysis emphasizes and how recommendations are framed. • Use professional judgment before taking action, especially for high-impact decisions.
Yes. Even with the same dataset and prompt, wording and phrasing can vary because generative AI output is not guaranteed to be fully deterministic. However, the essential analytical meaning should remain consistent, and factual/statistical components remain grounded in your uploaded data. To improve reproducibility: • Reuse the same prompt (or use a recommended prompt). • Keep the dataset version consistent. • Save the prompt and outputs used for reporting.
Not currently. Because uploaded datasets can vary widely by context and structure, ARIF does not provide out-of-the-box industry benchmark comparisons. We recommend benchmarking against your own historical baseline (e.g., previous periods, prior projects, or a control group) where appropriate.
Yes. Before turning outputs into actions, we recommend: • Confirm the dataset is correct (right file, timeframe, and columns). • Check data quality (missing values, inconsistent categories, mixed data types). • Spot-check a small sample against the original data source. • Re-run the analysis after cleaning to confirm stability. • Use a specific prompt aligned to your business question. • For high-impact decisions, have a second reviewer validate conclusions.
Better inputs lead to more reliable and useful outputs. We recommend: • Use clean, well-structured data: consistent column names, consistent data types, and minimal duplicates. • Reduce missing or ambiguous values where possible, and document definitions for key fields. • For transcription, use clear audio (minimal background noise) and ensure the speaker is close to the microphone. • Use a specific prompt aligned to your business question (or start from a recommended prompt). • If results look inconsistent, refine your prompt and re-run using the same dataset version to compare. Feature-specific guidance is provided in separate feature guides.
ARIF combines two layers: (1) analytical statistical computations that produce charts, tables, and metrics based on your uploaded data and (2) an AI writing layer that explains the findings in plain language and drafts summaries and recommendations. For transcribe, ARIF uses speech-to-text and language-understanding technology. The specific AI models may be updated over time to improve quality.
Not always. When ARIF generates written summaries and recommendations, the wording can vary slightly between runs. However, the underlying calculations and charts are driven by your dataset and selected options and should remain consistent when the inputs remain unchanged.
No. ARIF does not use uploaded customer data to train ARIF’s AI models (as stated in the Privacy Policy and Terms of Service).
ARIF may use trusted service providers to enable certain features (including analysis and transcription). These providers process data only to deliver the requested service and are required to protect confidentiality and security. Vendor details can be provided on request when appropriate.
Results depend on data quality and the intention of your prompt. If your dataset is incomplete, noisy, or inconsistent, outputs may be less reliable. Transcription quality may be affected by low audio quality or overlapping speakers. For statistical analyses, results depend on the method's assumptions and the structure of the uploaded data.
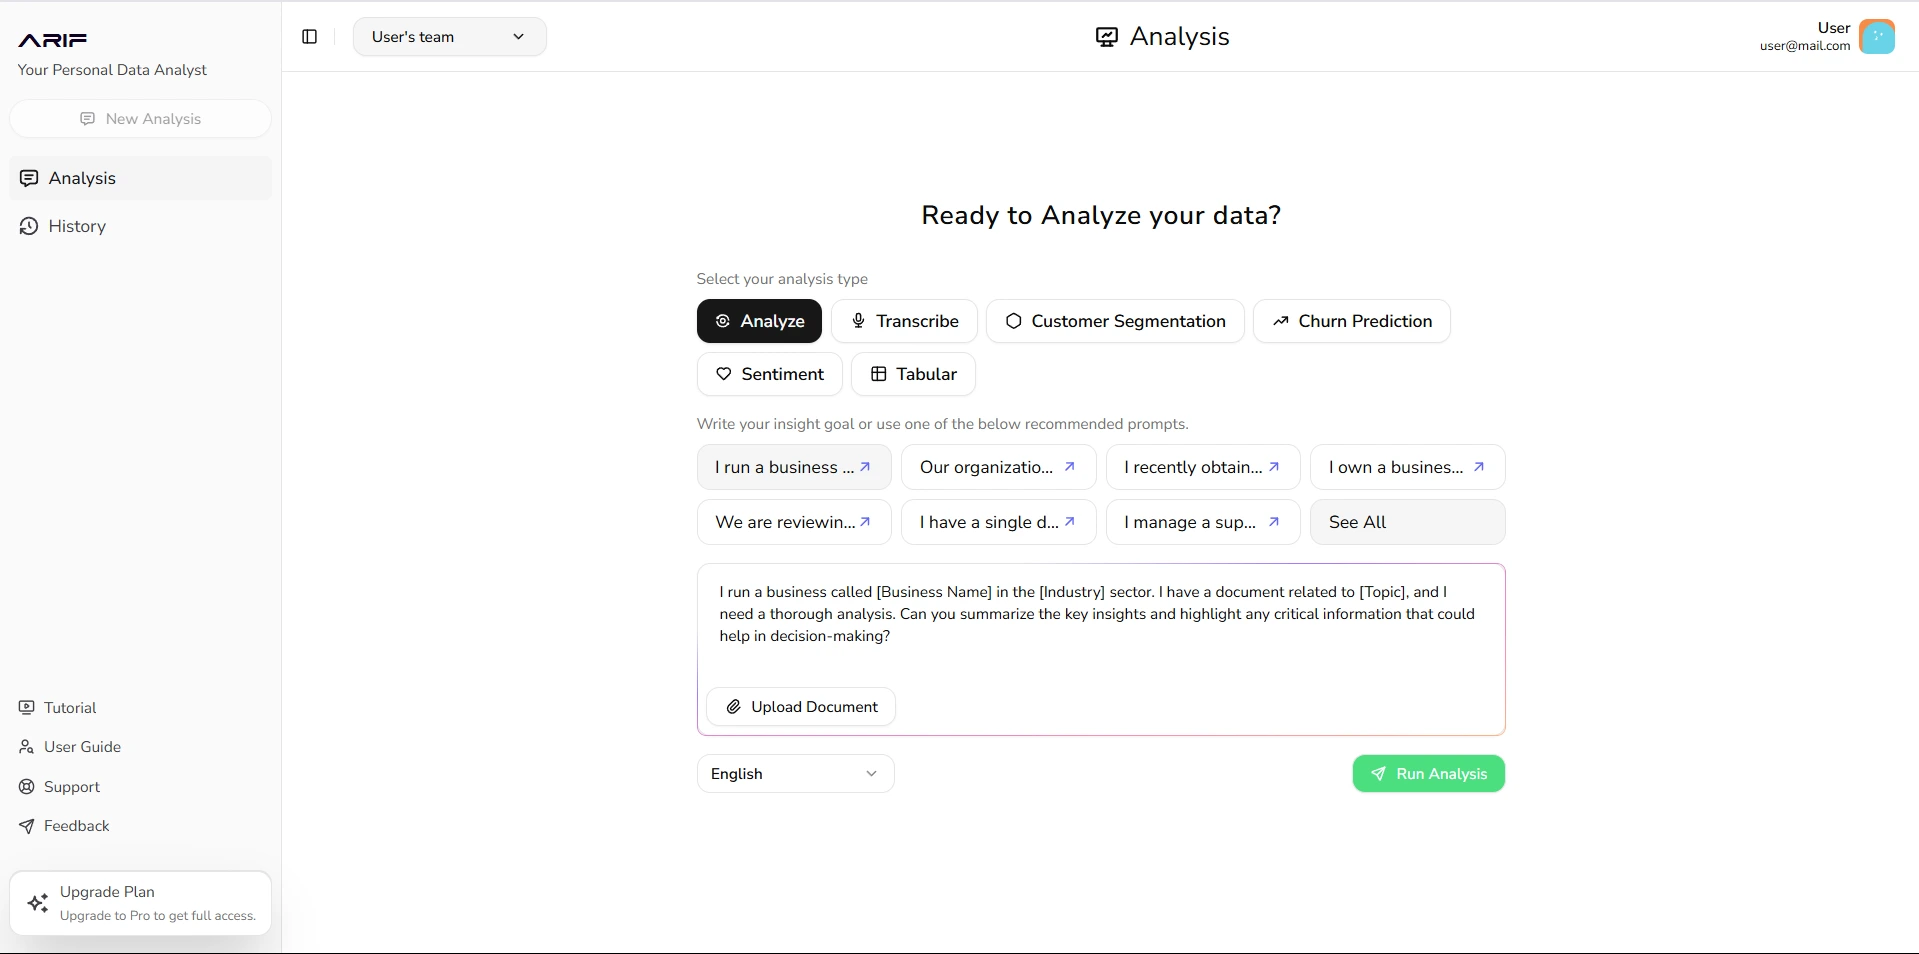
Most analyses follow this workflow: (1) Choose Analysis Type, (2) Choose a Recommended Prompt or write a Custom Prompt, (3) Upload file(s), then Run Analysis. Results appear in the platform, and you can ask follow-up questions via the chat panel.
Supported file types vary by feature. Most analyses support common document and spreadsheet formats, depending on the selected analysis. Transcribe supports MP3/MP4/WAV and may also accept a Google Drive or YouTube URL. The current maximum file size is 20 MB per file for the Analyze feature and 30 MB for other tabular-based analysis.
ARIF Support is available via email at [email protected]. If you need help, include your account email, feature name, and a short description of the issue.
Yes. ARIF is designed to be self-service for end users. If you require onboarding assistance, best-practice guidance, or enterprise configuration, contact ARIF support.
Yes. Free access is available as either 5 analyses or 30 days of access, whichever comes first (subject to the Terms of Service).
Credits are used to run analyses. Each time you click Run Analysis, one credit is used.
If your plan includes analysis credits, running one analysis typically consumes credits once per run. For example, running Sentiment Analysis once consumes a credit; re-running it consumes another credit. Downloading reports (PPT/PDF) and asking follow-up questions via “Chat with your result” do not typically consume additional credits. Your current balance is visible in the platform header. Note: Credit rules can vary by feature and may be updated; always refer to what the platform shows at the time you run an analysis.
Use the Upgrade Plan section in the platform to choose a plan or top up credits. If you have a voucher, you can enter the voucher code during checkout.
Credit rollover and expiry depend on your plan and contract. Refer to your subscription terms or contact ARIF support for plan-specific confirmation.
Data availability and retention depend on your subscription tier and retention policy. Refer to the Data Security & Integration section for retention periods, and contact ARIF support if you need a specific export or transition plan.
ARIF implements security controls designed to protect data and platform access. Controls include encryption in transit and at rest, access controls, and monitoring. For organizations requiring detailed security documentation, contact ARIF support.
ARIF stores and processes customer data in a cloud infrastructure: Google Cloud Platform (GCP): Instance: asia-southeast1-b Bucket: australia-southeast1
No. ARIF does not sell customer data and does not use customer data for ad targeting.
Yes. For enterprise or corporate engagements, ARIF can sign an NDA to protect confidential information as part of the commercial agreement.
Retention depends on your subscription tier and applies to both uploaded files and generated results: Free: 90 days. Premium: 90 days. Professional: 360 days. Enterprise: 2 years. If required, please contact ARIF support for specific requirements.
If you delete an item (such as an analysis output or project asset) or delete your account, ARIF deletes it immediately in the platform user experience. If you require deletion confirmation for compliance purposes, contact ARIF support. Deactivating did not delete the data.
This depends on your contracting country. For international customers, the contracting entity is Orison Tech Pty. Ltd. (Australia). For customers in Indonesia, the contracting entity is ARIF Analytics. Your contract will specify the applicable entity and governing terms.
ARIF supports single sign-on (SSO) for eligible plans (Google or LinkedIn). SCIM provisioning is not currently available. If you are an administrator and require SSO setup details, contact ARIF support.
For billing, subscription, or account access questions, contact ARIF Support at [email protected] with your account email and any relevant screenshots.
Significant changes may be reflected in documentation and product announcements. For enterprise customers, ARIF can provide update notes during onboarding. Appendix A. Feature list • Analyze: Uncover insights from uploaded documents and datasets using prompts. • Transcribe: Turn audio/video into transcripts and insights. • Sentiment Analysis: Reveal sentiment and themes from text feedback at scale. • Customer Segmentation: Group customers by shared characteristics and behaviors. • Tabular Analysis: Generate insights from tabular data and key takeaways. • Regression Analysis: Explore relationships between variables to predict outcomes. • Correlation Analysis: Identify patterns and connections between variables. • Factor Analysis: Group related variables into meaningful factors. • Gap Analysis: Measure distance between current performance and goals. • Cross-Tabulation Analysis (Crosstab): Analyze relationships across categorical variables. • Trend Analysis: Examine patterns and change over time. Part B. Feature FAQs This section provides feature-specific FAQs for ARIF. Each feature guide explains inputs, outputs, downloads, and interpretation notes for that feature.
Upload a CSV/XLSX file and select the column that contains text feedback. Sentiment is computed per row/record based on that column.
Select the column that contains the review, comment, or feedback text you want to classify. The column should contain readable text rather than numeric codes.
Stop words are common words that often add little meaning to themes and keyword summaries. You can add custom stop words to reduce noise and focus on more informative terms.
The sentiment score is a numeric indicator of how strongly the model associates a row with the assigned sentiment label. Use it as a prioritization signal (e.g., investigate the strongest negative items first), and validate with samples of the raw text.
No. The action plan is prompt-dependent. A more specific prompt usually produces recommendations that are more aligned with your context and goals.
ARIF supports multiple languages. Choose Indonesian if your data is in Indonesian. Choose Other for all other languages (including English).
Yes. Download the Full Sentiment Result (XLSX), which includes review_text, sentiment_label, and sentiment_score for each record.
You can upload audio or video files (e.g., MP3/MP4) or provide a direct URL (including YouTube or Google Drive URLs where supported). The URL must be accessible and point to a supported audio/video resource.
No. Transcribe auto-detects the language; no manual selection is required.
Word (DOCX) provides a readable transcript with speaker labels. Excel (XLSX) provides a structured transcript table with speaker labels and start/end timestamps per sentence/segment for easier review and filtering.
Speaker labeling can be less accurate when speakers overlap, speak at the same time, or when audio quality is poor. Spot-check important segments against the original audio/video.
Use clear audio and avoid background noise where possible. Record with a closer microphone and reduce echo or overlapping speakers when you can.
No. In fact, unique identifiers are not useful for clustering and can distort results. Upload meaningful attributes instead.
ARIF currently selects the number of clusters automatically. If you need a fixed number of segments, contact ARIF support to discuss options.
Yes. When available, ARIF provides a full Excel export containing your original rows plus cluster label and membership confidence/probability.
ARIF uses the target variable to focus the summary and recommendations on the relationships most relevant to your analysis goal.
Some columns may be excluded by preprocessing (e.g., high missingness, identifier-like columns, or date/datetime fields). This reduces noise and improves interpretability.
For methods that require a confidence level (e.g., confidence intervals, margin of error), ARIF currently supports 90% and 95%.
Yes. Some methods (e.g., Z-test, T-test, ANOVA, frequency distribution) allow selecting multiple columns in a single run as shown in the platform UI.
ARIF uses the target variable to focus the regression model, summaries, and recommendations on the outcome you want to explain.
ARIF uses Ordinary Least Squares (OLS) linear regression to estimate relationships between the target and other eligible variables.
Categorical variables are encoded into numeric features before modeling, so they can be used alongside numeric columns.
Some columns may be excluded by preprocessing (for example, identifier-like columns, date/datetime fields, high-missingness columns, or high-cardinality categoricals). This helps reduce noise and improve interpretability.
No. The client-facing report focuses on coefficient-based interpretation and narrative insights. Statistical significance values (p-values), confidence intervals, and evaluation metrics (for example, R² or error measures) are not shown.
If the dataset and target selection are unchanged, coefficient calculations should remain consistent. However, AI-generated summaries and recommendations may vary slightly in wording between runs.
Regression estimates associations while holding other variables constant. Correlated predictors, outliers, scaling, or proxy variables can affect coefficient direction and magnitude. Treat results as decision support and validate with data context.
Correlation and association require pairs of variables. ARIF needs at least two selected columns to compute relationships.
Use Pearson when you expect a linear relationship and data is relatively well-behaved. Use Spearman when relationships may be non-linear/monotonic, distributions are skewed, or outliers are a concern.
In the current report output, ARIF computes numeric–numeric correlations and categorical–categorical associations, and ignores cross-type pairs (numeric–categorical).
Some columns may be excluded by preprocessing (for example, high-missingness columns, identifier-like columns, date/datetime fields, or high-cardinality categoricals). This reduces noise and improves interpretability.
Yes. You can select multiple variables in one run (minimum 2). ARIF will compute all eligible within-type pairs among the selected variables.
Factor Analysis is an unsupervised method. It focuses on discovering underlying structure among variables rather than predicting a specific outcome.
Factor Analysis currently uses all eligible columns by default to provide a consistent, low-friction workflow. If you want to exclude variables, remove them from the dataset before upload.
ARIF determines the number of factors automatically based on the dataset’s eigenvalue pattern (supported by the scree plot) to balance explanatory power and interpretability.
Some columns may be excluded by preprocessing (e.g., identifier-like fields, datetime columns, low-variance fields, or high-cardinality categoricals). This reduces noise and improves interpretability.
Factor scores are included in the generated report for interpretation. If you need score values for downstream modeling, you may need to reproduce the computation in your own analysis workflow (Excel export is not currently available).
Gap Analysis compares a numerical metric across categorical groups. The categorical column defines the groups, and the numerical column provides the metric being compared.
Yes. You can select multiple categorical columns. ARIF will compute group comparisons for each selected grouping column using the same numerical metric.
Rows with missing values in the selected columns are excluded from the computation. In addition, categories with no remaining valid rows after filtering will not appear.
Statistical significance indicates the observed group differences are unlikely to be due to random sampling variation alone, given the assumptions of the test. It does not measure business importance and does not imply causality.
ARIF supports downloading one PDF (Insights & Statistics) and one PPT (Insight Summary) for Gap Analysis.
Columns may be excluded by preprocessing (e.g., high missingness, identifier-like columns, date/datetime fields), or may be ineligible for Cross-Tabulation because they contain too many unique categories, which makes results unstable and difficult to interpret.
In the current workflow, ARIF cross-tabulates each selected row variable against the constant column variable. If you want to test different pairings, rerun the analysis by changing the constant column variable.
ARIF uses the chi-square test of independence and reports significance using α = 0.05.
Cross-Tabulation is designed for categorical variables. If you need to include a numeric column, consider categorizing (binning) it before uploading, or use other ARIF analyses designed for numeric comparisons.
Ensure the date column contains valid date/time values (e.g., YYYY-MM-DD). If your dates are stored as text or use uncommon formats, convert them to a standard format before uploading.
Not in a single run. Trend Analysis currently supports one target variable per run. If you need multiple targets, run the analysis separately for each target.
No. Trend Analysis focuses on trend, persistence, and stationarity diagnostics. For forecasting, you should use a dedicated forecasting workflow or statistical model.
No. ARIF does not modify your uploaded file. Preprocessing steps (e.g., forward-fill for diagnostics) are applied in-memory to compute outputs and do not overwrite your source data.
Yes. You can upload up to 10 files per run. ARIF will synthesize across them and reference evidence from the relevant file(s).
Not currently. ARIF uses only what you upload. Internet search/browsing is planned as a future capability.
The underlying sources and extracted evidence remain the same, but the AI may phrase or structure the narrative differently. Use excerpts/tables and downloaded reports as a stable reference.
ARIF does not modify your uploaded files. Preprocessing is applied in-memory to generate outputs. Data handling policies are covered in ARIF’s terms and privacy documentation.